Math 110-01, Spring 2208
Assignment 6: Order and Chaos
This assignment begins with a class in the computer lab, Gulick 208, on Wednesday, February 27. You might be able to finish the assignment during the class period, you you might have to continue the work later on your own.
You will use two computer programs for this lab, MandelbrotViewer and ChaosGame. Both of these programs were demonstrated in class on Monday. On the Windows computers in the computer labs, you will have to use special versions of these programs (because of misguided security policies on those computers). You will find copies of these programs in the folder named cpsc120 on the PCCommon network drive. If you have problems locating them, ask for help. Just double-click the icon to start the program.
Outside the labs, you can run the programs on any computer that has Java 5.0 (or higher) installed. This includes most computers, as long as they are fairly new, but it is possible that some computers have older versions of Java or no Java at all. The programs can be downloaded for use on your own computer using the following links:Save the program on your hard drive, and double-click the icon to run the program.
Exercise 1: The Mandelbrot Set
The Mandelbrot set is defined as follows. To test whether a point (a,b) is in the set, start by setting x = a and y =b. Then perform the following process that repeatedly replaces the value of (x,y) with a new value:
         REPEAT:
             Let xnew = xold2 + yold2 + a
             Let ynew = 2 xold yold + b
If the point (x,y) stays forever within a distance of 2 from the origin (0,0), then the starting point (a,b) is in the Mandelbrot set. If the point (x,y) ever leaves this region, then the starting point (a,b) is not in the Mandelbrot set. Note that testing whether a point is in the Mandelbrot set requires an infinite amount of work, so in practice it might be impossible to say for sure that a given point is in the set. On the other hand, by doing enough work, it is possible to be sure that a point is not in the set; the problem here is that there is no way to tell in advance how much work you will have to do.
Start up the Mandelbrot Viewer program. When it first starts, the program shows a region of the xy-plane that contains the entire Mandelbrot Set. Colored points are points that are known to not be in the Mandelbrot set. The Mandelbrot set is shown in black, but remember that anytime you see a black point, it's not absolutely certain that it is in the Mandelbrot set -- it's possible that it is not in the set but that the program did not do enough work to determine this. Each colored points is colored to reflect the amount of work that was done in order to determine that the point is not in the Mandelbrot set. That is, the program counts the number of steps in the above process until the point (x,y) moves more than two units away from (0,0). This is called the number of iterations. The color of the point reflects the number of iterations.
You can start exploring the Mandelbrot set. To zoom in, click and drag to draw a rectangle around some part of the set. When you release the mouse, the inside of the rectangle will be expanded to fill the entire window. (If you click and drag with the right mouse button, you will zoom out instead of zooming in.) If you make a mistake, use the "Restore Previous Limits" command in the "Control" menu. Note that the interesting parts of the set are along the boundary between the black and the colored regions, including the many "filaments" that lead out from the set.
As you explore, you should use the "Max Iterations" and "Palette Length" menus to get the best view of the set. As you zoom in, you will certainly have to increase the maximum number of iterations. Doing so will often fill a black region with color. (Make sure you understand why this is true!) The "Palette Length" helps you control the number of colors that are visible. If the screen is close to a uniform color, you might bring out more detail by decreasing the palette length. If the color varies too much in the picture, try increasing the palette length.
What to turn in. Your goal is to find a beautiful and interesting picture. You might get a little more credit for looking deeper into the set. The grade on this exercise will be to some extent competitive. When you have found the picture that you like, you should save two things: The picture and the "param file" that describes the picture. Use the "Save PNG Image" command in the "File" menu to save the picture, and use the "Save Param File" command in the "File" menu to save the param file. (A param file can be re-opened later to restore the same image in the program.) I want to see the param file so that I can tell exactly what part of the set your picture comes from.
Save the image using a name that includes your own name as well as "ex1". For example, if your name is "Fred Smith", you can save the image under the name "fred-ex1.png" (or "smith-ex1.png" if you want to be more formal). Similarly, save the param file with a name such as "fred-ex1.mdb". Follow the instructions at the end of this web page for getting these files to me.
Exercise 2: Chaos Game, Part 1
The second program, Chaos Game, also defines images by moving points around on the plane. A chaos game is defined by a set of "maps." A map is a way of taking the large square shown in the program and mapping it onto a smaller region, which can be a square, a rectangle, or a parallelogram. These regions are shown in the program's window. The point of the program is to generate a picture in which the picture as a whole is duplicated, with scaling and possibly some distortion, within each of the map regions. The result is a geometric figure that is made up of smaller, modified copies of itself. This is a fractal. (A true fractal is self-similar on all levels of detail, but of course in a computer program we can only get a finite approximation.) What is most surprising is that this perfect, infinitely detailed object is created using a random process. The process is this: to produce one point in the image, start with a randomly selected point in the large square. Then repeat the following step 100 times: Pick one of the maps at random, and apply that map to the point; that is, move the point from its current position in the large square to the corresponding point in the map's region. Leave the point in its final position as a permanent part of the image. Do the same thing over and over again to add more points to the image.
When using the program, you can add new maps using the "Add Map" menu. A newly added map is automatically "selected," and is shown filled in with gray, and with various "handles" that you can drag. Drag one of the corners to make the map bigger or smaller. You can drag a corner point right through the center of the map; this will "flip" the map over and reverse its orientation. Drag the blue arrow to rotate the map. Drag one of the black arrows to move a side in the direction of the arrow, or drag any other part of a side to scale the map in one direction only. Drag anywhere in the gray interior to move the map as a whole.
Click outside the selected map to de-select it. When no map is selected, you can click on any map to select it. You can delete the selected map using a command in the "Control" menu, and you can also change the selection using this menu.
When there are at least two maps, the program generates an image as described above. If a map is selected, then a very rough image is generated using a small number of large purple points. This is meant as a preview to give you some idea of what the real image will look like. If no map is selected, then the program runs the process described above, adding more and more points to the image.
You can begin by trying the examples in the "Examples" menu. I suggest that you look at these examples, and try modifying them by selecting one of the maps and modifying it to see what effect that has on the image. You can also play around with making new examples from scratch.
Exercise 2: Figure out what simple modification was made to the "Sierpinski Gasket" example to produce each of the following images:
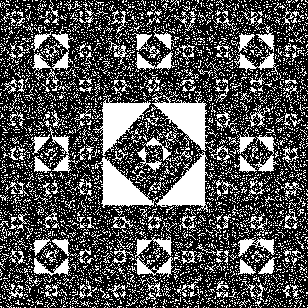 | 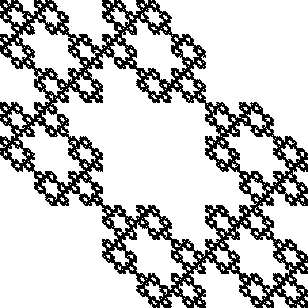 |
You can include your answer in an email to me, or save it in a file with a name of the form "fred_ex2.txt" and submit it as described below.
Exercise 3: Chaos Game, Part 2
The last exercise, of course is simply to produce as pretty a picture as you can using the ChaosGame program. Design the maps and decide whether to use the "Color Code Maps" option or not. Save both a PNG Image and a "Map Data File." Use file names that include your name as well as the string "ex3", such as "fred-ex3.png" and "fred-ex3.txt". Submit the files to me as described below.
Submitting your files
To submit your work for this assignment, you can either copy them to the folder named "drop box" in the "cpsc120" folder on the PCCommon network drive, or you can send them to me as attachments in an email. Please make sure that the file names include your own name, so that I won't lose track of which files come from which person. The work must be submitted no later than 3:00 PM on Tuesday, March 4.