Explore the Mandelbrot Set
THE MANDELBROT SET is a famous mathematical object. The picture at the right is a visualization of one tiny section of this set. I'm not going to tell you much about the Mandelbrotset here. You can find lots of information about it on the Web. You can also find a variety of applets for exploring the Mandelbrot Set. Here are mine. Just click a button on this page to launch one of my applets in its own window. (These applets require Java 1.4. If you don't see any buttons on the page, you probably do not have Java installed in your browser or have an old version.)
(Mac users: It seems like the applet can drop some vertical lines, at least on some Mac's, for some reason that I don't understand. Also, palette animation might be a problem.)
The Mandelbrot Applet
(Might require two clicks on Windows.)
The Mandelbrot Applet draws the Mandelbrot set and allows you to zoom in on any region of the set. To get an idea of the variety of images that can be produced, take a look at the "Built-in Examples" in the "Examples" menu.
You can use the following mouse actions on the picture:
- Left-click -- zooms in by a factor of two on the point where you click. That point is moved to the center of the image.
- Shift-left-click -- zooms in by a factor of two on the point where you click. That point stays at the same position in the image
- Right-click or control-click -- zooms out by a factor of two from the point where you click. That point is moved to the center of the image.
- Shift-right-click or shift-control-click -- zooms out by a factor of two from the point where you click. That point stays at the same position in the image.
- Click-and-drag -- allows you to draw a rectangle around a portion of the image. When you release the mouse button, the area is zoomed out to fill the entire image. Note that the rectangle is constrained to have the same shape as the image.
You'll also find zoom commands in the "Control" menu. These commands zoom in and out by a factor of two from the center of the image.
Unfortunately, when you zoom in too much -- which can happen very quickly! -- the image will become blocky. This means that you have reached the limits of accuracy for the type of numbers that are used in the computation. Real numbers have an infinite number of digits after the decimal point, but the computer is using numbers that have only about 16 digits of accuracy.
The Mandelbrot set is actually the region that you see colored in black when the applet first starts. (You can change the color using the "Mandelbrot Color" menu.) More exactly, black points are possibly in the set, but for some black points, more computation would show that they are not really in the set. Colored points are definitely outside the Mandelbrot set. The color depends on the number of "iterations" that are computed before it is determined that the point is not in the set. Points that are closer to the set require a larger number of iterations. The "MaxIterations" menu determines how many iterations the program will compute for a given point before giving up and coloring that point black. Increasing the maximum number of iterations might change some points from black to colored. For example, look at Example number 4. This example has some large black areas, but if you increase the number of iterations in the "MaxIterations" menu, you will see that some of the black area should actually be filled with color.
The palette menu determines the set of colors that are used. The "Spectrum" palette is the most useful, although the other palettes can produce nice effects in some cases. The hardest thing to understand in this menu is the choice between "Duplicate Palette" and "Stretch Palette." Only 250 different colors are available in a palette. The color of a pixel depends on how many iterations are needed to determine that the point is not in the Mandelbrot set. However, the maximum number of iterations can be set to be much higher than 250. This means that the same color has to be used for several different iteration counts. In the "Duplicate Palette" setting, the colors are used for the first 250 iteration counts; then they are reused for the next 250; then for the next 250, and so on. This means that the same color is used when the iteration count is N, N+250, N+500, N+750, and so on. With the "Stretch Palette" setting, a single copy of the palette is stretched to cover the entire palette. If the maximum iteration count is 1000, for example, then color number 1 is used for an iteration count of 0, 1, 2, 3, or 4; color number 2 is used for a count of 5, 6, 7, 8, or 9; color number 3 for 10, 11, 12, 13, or 14; and so on. The two settings can give very different visualizations of the Mandelbrot set. For example, look at Example number 11. This example uses "Duplicate Palette". After the drawing is completed, change the setting to "Stretch Palette" in the "Palette" menu, and redraw the image by selecting "Start Drawing" from the "Control" menu. Very different! (This is also a good example for trying out a "Palette Animation" from the "Palette" Menu. Animations are cool, but are also useful because certain parts of the spectrum will show more detail in the picture than others. Try animating the "Stretch Palette" version of Example 11.)
I will leave you to explore the rest of the menus on your own.
The MandelbrotOrbits Applet
The "iterations" mentioned above consist of computing a sequence of points starting from the point that you are interested in. This sequence is called the orbit of the point. The MandelbrotOrbits applet lets you investigate the orbits (sequences of points) that are produced in this way. This is a fairly simple applet. It shows a gray-scale version of the Mandelbrot set. There are no menus, and you can't zoom in on the set. However, you can click on a point to see the orbit associated with that point. The x and y coordinates of the starting point are shown in the input boxes at the bottom of the applet. You can also select the starting point by editing the contents of these boxes; press return in one of the boxes or click the "Set" button to make the change effective.
Only the first 120 points (by default) on an orbit are shown. The number of points can be varied between 1 and 1000 using the slider on the bottom right. The points are colored with the colors of the spectrum, from red to violet, so you can tell the order in which the points are generated.
Here are the mouse actions that are available:
- Left-click -- show the sequence of points, starting from the point where you click.
- Left-click-and-drag -- show the sequence of points, starting from the point where you click, and then compute a new sequence each time the mouse moves.
- Right-click or control-click -- show the same sequence of points as a left-click, but instead of drawing points, draw a line segment from each point to the next point.
- Right-click-and-drag or control-click-and-drag -- same as right-click, but the sequence of points is recomputed as the mouse moves.
- Middle-click or shift-click -- will clear the image.
- Middle-click-and-drag or shift-click-and drag -- will draw a straight red line. When you release the mouse button, each point on this line (actually only 120 of them) is used to produce a sequence of points. The result is a sequence of curves that represent the successive iterations of the entire line that you drew.
Added Later: Improved MandelbrotOrbits Applet
While preparing for a talk on the Mandelbrot Set, I have realized that my MandelbrotOrbits applet really suffers from the lack of a way to zoom in on small regions of the set. So, I wrote MandelbrotOrbits2. This new version has two windows. The larger window has exactly the same functionality as the MandelbrotOrbits window in the earlier applet. The smaller window is a somewhat simplified adaptation of the window from the Mandelbrot applet at the top of this page. To use the newer version, click here:
When you left- or right-click on the picture in the larger window, the orbit will be drawn in both windows. The smaller "zoomer" window can be used in two ways: (1) You can zoom in and out by clicking-and-dragging, by left- or right-clicking, or by using menu commands -- the window works this way if the "Zoom In/Out" option is selected at the bottom of the window. Or, you can: (2) Use the mouse to select the starting point of an orbit -- the window works this way if the "Select Orbit" option is selected at the bottom of the window.
In the "Select Orbit" mode, you can click or click-and-drag with either the left or right mouse button. The mouse position gives the starting point of the orbit. The orbit is drawn in both windows. The orbit is always drawn as a sequence of dots in the Zoomer window. In the larger Mandelbrot Orbits window, it's drawn as dots if you used the left mouse button and as lines if you used the right mouse button. Usually, of course, you will see only a small part of the orbit in the Zoomer window. You can use the other window to get an overview of the whole orbit.
The source code for MandelbrotOrbits2 is something of an ugly hack combining the code from the two original applets. However, you can browse the code if you like.
Download info:
You can download the "jar" files for the applets using these links: Mandelbrot.jar and MandelbrotOrbits.jar and MandelbrotOrbits2.jar. You should be able to run the jar file either by double-clicking it or with a command such as "java -jar Mandelbrot.jar" on the command line.
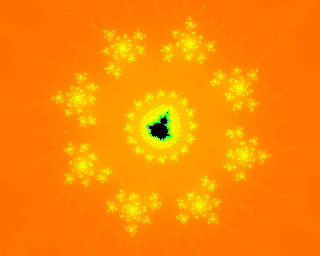
When you run the Mandelbrot.jar file in this way, the Mandelbrot menu will have a "File" menu with commands for making a PNG image of the current picture and for saving and opening "parameter files" that contain enough information to redraw the image when you run the program again. For example, the image at the top of this page was created in this way, from the parameter file fractal_rings_2.params.txt.
If you are interested, you can browse the source on line. (Disclaimer: This is not meant as an example of good programming, and there are no comments in the code!) You can also download the same source code directory as a zip archive, MandelbrotSource.zip.